Performing farm tasks (like planting, or controlling insects and weeds) based on calendar dates produces variable results because weather conditions change from year to year. Phenology is a more accurate method of scheduling activities and therefore achieves better farm results.
WHAT IS PHENOLOGY?
Phenology is the study of recurring natural events and their relationship to weather. It has been used as a farm predictive tool for over 3oo years. The seasonal blooming of trees and insect emergence are examples of phenological events.
The development rate of both insects and plants is determined by temperature, but research has shown that plants bloom and insects emerge in virtually the same order every year, no matter what kind of weather occurred previously.
Denise Ellsworth of the Ohio State University entomology department says, “the sequence of events remains consistent from year to year. While the pace of the sequence may change depending on the weather, with a warm spring bringing on a fast progression of bloom, the sequence of flowering and insect emergence remains the same. Farmers can easily use this sequence to anticipate plant and pest activity.”
UNDERSTANDING GROWING DEGREE DAYS (GDD)
Since the development rate of both insects and plants is temperature-dependent, heat accumulation can be used to predict when plants will grow and insects emerge. “Growing degree-days” are a common method used to measure heat accumulation and make these predictions.
Growing degree-days (GDD) are calculated as the sum of the number of degrees a day’s average temperature exceeds a base temperature. The base temperature most often used to calculate GDD is 50°.
For example, if the average daily air temperature on a given day was 58°F, the GDD for that day would be 8 (58° (avg. temperature) – 50° (base temperature) = 8 (GDD)). Starting at the beginning of the growing season (usually January 1), the GDD numbers are added together daily to give an accumulated GDD (accumulated heat units). Negative growing degree-days are counted as zero.
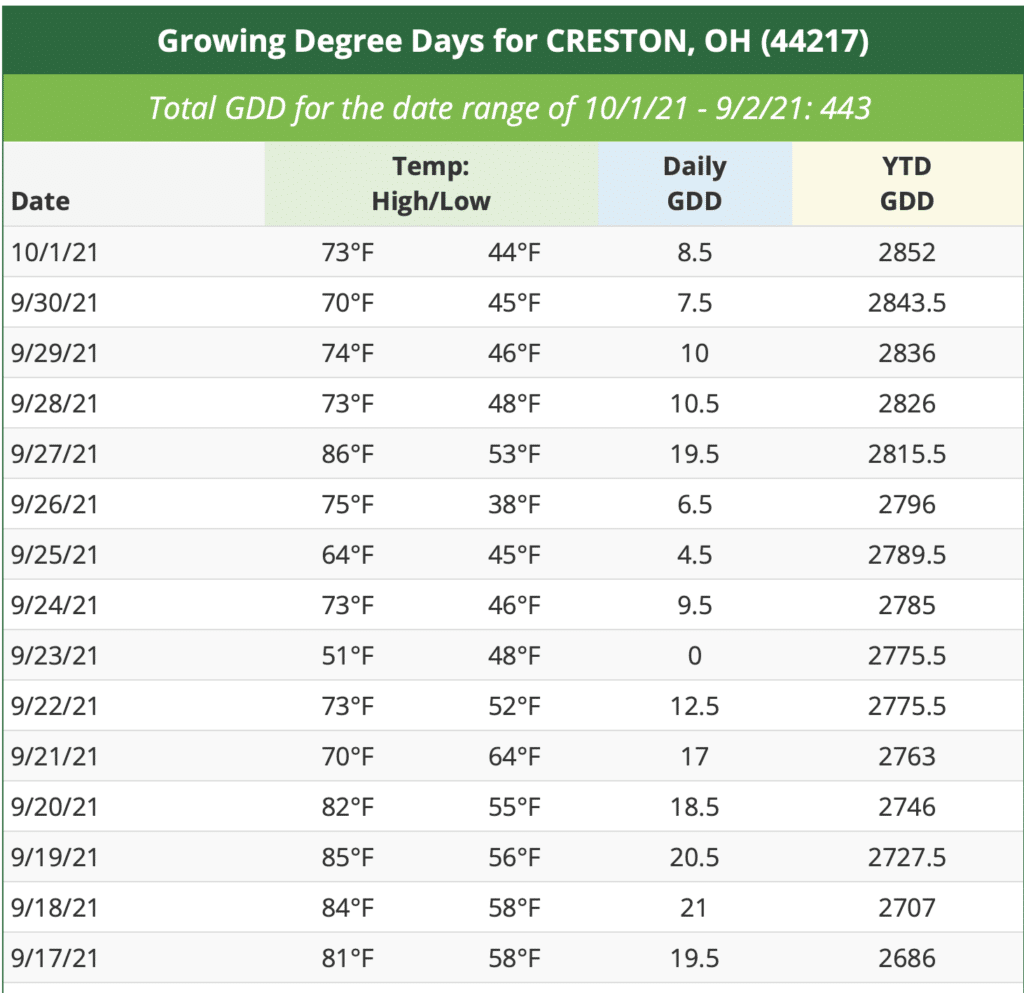
Accumulated GDD for Creston, OH on 10/1/21
HOW GDD ARE USED
Since insect emergence and plant growth are temperature dependent and the sequence remains the same, a GDD can be assigned to each phenological event in a region. The chart shown in Table 1 is specific to our farm in Ohio and shows the GDD necessary for the partial spring sequence of plant bloom and insect emergence there.
So, I know that whenever 34 GDD (or heat units) are accumulated in spring, regardless of whether it’s January or March, the silver maples will begin to bloom and when 58 heat units are accumulated, the forsythia will begin blooming. But, how is this concept useful on a homestead? The following examples provide a few ideas on the power of phenology.
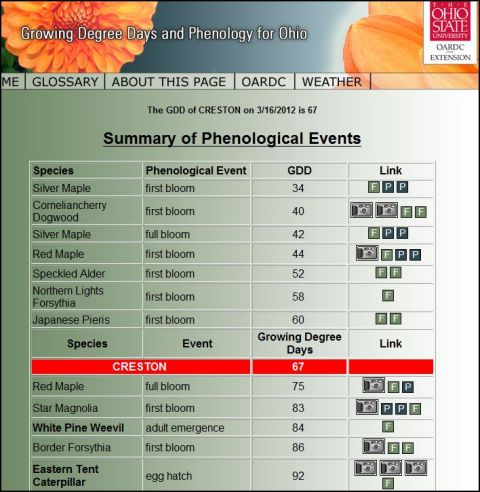
Table 1 – Ohio Partial Phenology Sequence and Growing Degree Days (Creston, Ohio)
PREVENT CROP PEST DAMAGE
By knowing the emergence GDD for specific pests and how those species are most vulnerable, it’s often possible to greatly minimize pest damage. Table 2 below shows that Japanese beetles emerge around 970 GDD in Northeast Ohio. Knowing this, we can set traps and be on the lookout for Japanese beetles a few days before they emerge. We also know that the first Japanese beetles to emerge are scouts, and if the scouts are eradicated, later beetle hordes never arrive.
So, when our area had accumulated 901 heat units by June 20, we set beetle traps and diligently crushed beetles (particularly in the raspberry plantings). Our area passed 970 GDD on June 24, and we had record raspberry production and few Japanese beetles the rest of the summer.
With a few days of part-time effort, the Japanese beetles were virtually eliminated from the farm without using any pesticides. This would have been a much more time-consuming and error-prone task had we tried using calendar dates.
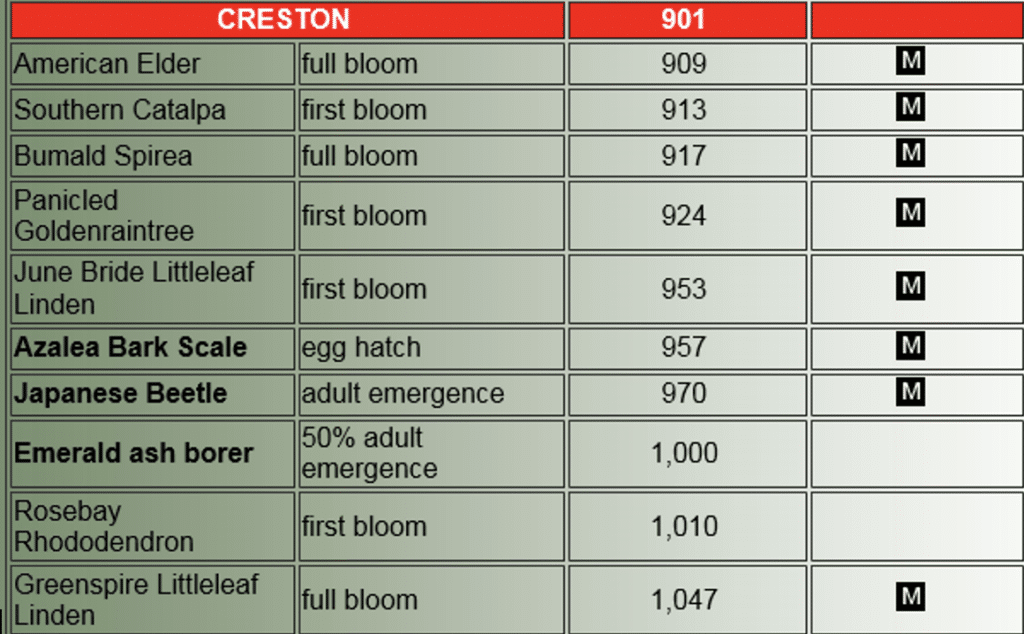
Table 2 – Ohio Summary of Phenological Events Creston, Ohio 6/20/2014
Pest species emergence usually corresponds with plant bloom for popular plants, so using a phenological calendar; it’s often not even necessary to know the specific elapsed GDD to predict events. For example, Japanese beetle emergence and Little-Leaf Linden tree bloom correspond (see Table 2), and it’s relatively easy to remember to start crushing beetles when Linden trees start blooming.
INCREASE CROP YIELDS
Not only can phenology and heat units be used to improve crop yields by minimizing pest damage, they can also be used to improve perennial yields by protecting the crops. For example, by adding the ripening of the particular cultivars of cherries and blueberries growing on the farm to our GDD calendar, we know when to cover plants with netting to prevent wild birds from consuming the crops.
Phenology and the GDD calendar are very helpful for perennial crops such as orchards and fruit, but much less so for annuals or vegetables. Because planting dates vary (were they started in a green house or high tunnel, direct-seeded or transplanted?) the heat units for development are not that useful for both the plants and the pests that may come with them..
Most advice on when to plant crops revolve around the last spring frost date and the first fall frost date for a specific area, and provide suggestions on how many weeks before or after these dates to plant each crop. However, these dates are averages and actual temperature conditions can vary widely from year to year. By tying planting times to the GDD necessary for the crop to germinate and grow instead, more precise planting times can be established and yields improved.
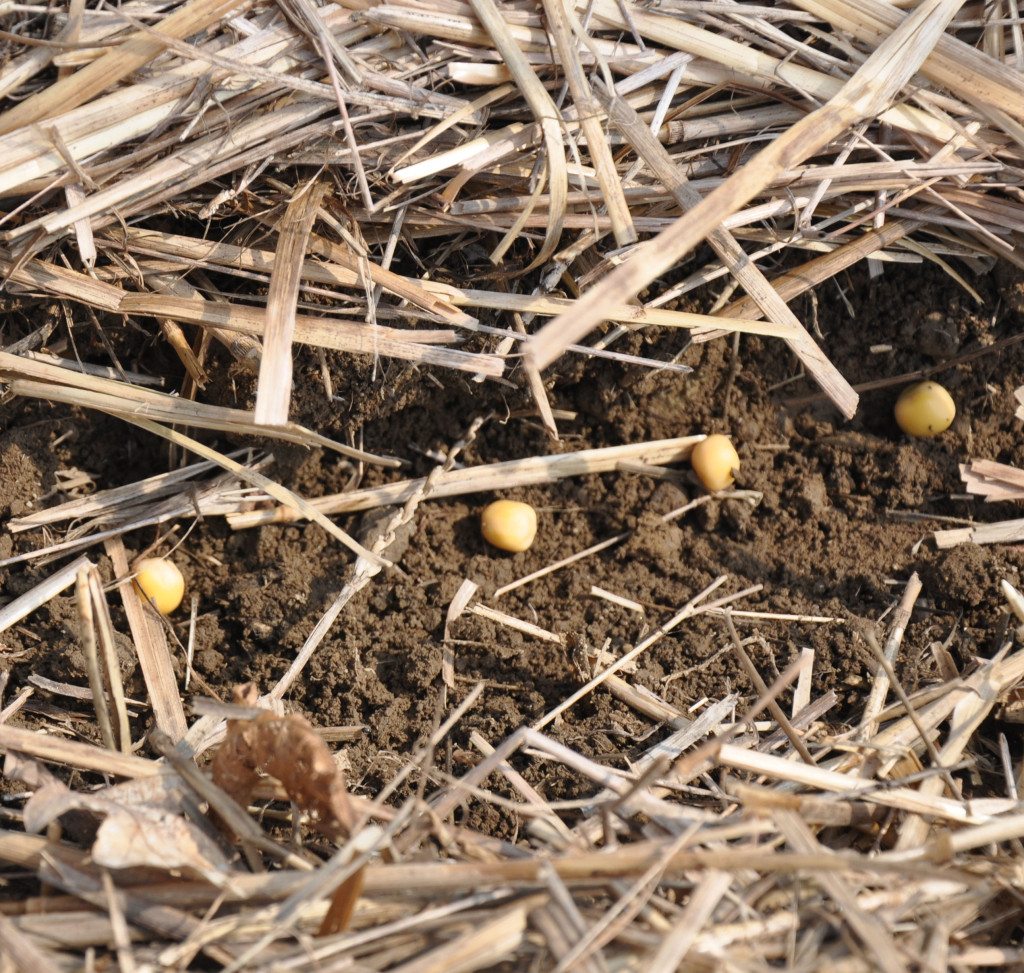
Know When To Plant Crops for Maximum Performance with Phenology
Common advice is to direct-seed peas six to eight weeks prior to the last spring frost date, which is around St. Patrick’s Day (3/17) in northeast Ohio. But, in a cold year peas planted at that time tend to rot, versus warmer years when they perform better if planted earlier. In year A, our GDD on 3/17 was 95 whereas in year B it was 12. So in year A, it was too warm to plant peas on St. Patrick’s Day, while in year B it was too cool for ideal pea growth and yield. By determining the optimal GDD for planting peas and adding it to our phenological calendar, we’re no longer at the mercy of yearly weather patterns. It’s more difficult to achieve improvements using phenology when growing annuals or vegetables, but it’s still possible for the observant farmer.
MINIMIZE WEEDS
Knowing the emergence GDD for weeds can reduce removal chores or eliminate the need to apply herbicides. Thistles were a particular problem in one area of our farm. They’re relatively easy to remove when young, but if their long taproots get established, removal is tough and time-consuming. By observing the GDD for thistle emergence and adding it to our calendar, we know when to flame-weed beds to eradicate thistles before they become a problem.
INCREASE HONEY YIELDS
There are many ways that phenology can be used to increase honey yields, but two of the easiest are by predicting nectar flows and assuring that there are season-long sources of nectar for the bees.
By knowing which nectar-producing plants are near our farms, using phenology to predict honey flows, and timing hive maintenance activities to coincide with those flows, beekeepers can increase honey production. Silver maple bloom is often an important first springtime source of nectar for bees. In our northeast Ohio, silver maples start to bloom at 34 GDD, and are in full bloom at 42 GDD. This usually occurs around the beginning of April, so wise beekeepers make sure honey supers are on the hives by April to catch that first maple honey flow. However, in a warm year, it was already 236 GDD on April 3rd, and beekeepers using calendars instead of GDD missed the honey (34 GDD actually occurred nearly a month earlier that year).
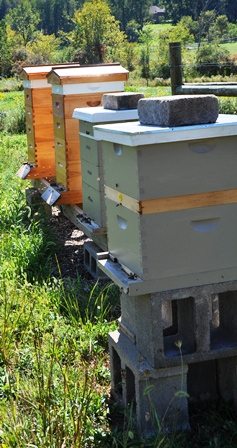
Honey Bee Hives Ready For Honey
Beekeepers can also increase honey production by learning the sequence of bloom for important nectar-producing plants in their area and making sure that these plants are available near their bee yards (to supply nectar continuously through the season). If there are gaps in the nectar production sequence, then new varieties of plants can be introduced to fill those gaps, and good perennial honey plants can be divided and offered to neighbors to increase nearby bee nectar sources.
GETTING STARTED WITH PHENOLOGY FOR THE HOMESTEAD
Today, it’s relatively easy to determine the GDD for your location on any given day (see below for some sources). Many states have online GDD calculators, there’s a national online GDD calculator, you can calculate your own GDD, or there’s even a GDD calculator application to download to your android or iPhone. When using GDD calculators, it’s important to verify they are using the same base temperature (most often 50°F) and remember that while much more accurate than calendars, GDD is still based on averages.
It can be more difficult to find calendars that tie the phenological events in your region to GDD. Sources for calendars include state universities, county extension agents, phenology calendars from weather regions similar to yours, or you can create your own phenology calendar.
While GDD online calculators and calendars are helpful starting points, it’s unlikely they’ll contain GDD information for all the plants and insects of interest on your farm (e.g. there was no GDD for thistle or pea emergence in the calendar we started with). In that case, you can create or expand on and personalize these biological calendars by tracking plant and pest activity on your own farms and penciling these observations into the sequence. This results in a customized biological calendar featuring events from an individual farm, with a sequence that remains consistent year after year. This sequence can also help beekeepers as they track bloom time and relate it to honey flow through the spring and summer.
CONCLUSION
As these ideas demonstrate, phenology and GDD can be used to determine when to best plant and harvest crops, when bees will bring in nectar, what kind of nectar they’ll collect, when to control harmful insects, and when to best eradicate weeds. But, these are just a few examples, and there are many other ways that phenology can be used. It’s an awesome tool that should be in every farmer’s arsenal.
PHENOLOGY SOURCE SITES
The following is a partial list of sites offering growing degree-day calculators (some sites also provide lists of phenological events by growing degree-day).
California GDD Calculator: http://www.ipm.ucdavis.edu/WEATHER/index.html#DEGREEDAYS
Cornell GDD Calculator: http://newa.cornell.edu/index.php?page=degree-days
Ohio GDD Calculator: http://www.oardc.ohio-state.edu/gdd/
Greencast GDD Calculator: http://www.greencastonline.com/growing-degree-days/home
Carol L says
Do these sources list the GDD for all locations, or just the ones for their own state?
I live in the Willamette Valley in Oregon…..How do I get the information for my specific location?
Thanks for an interesting article.